When going from a low listening level to a higher listening level, you want to BOOST midrange, not cut it. Our hearing is more sensitive to midrange frequencies, so at lower volumes, the mids will sound relatively louder. That will cause you to scoop your mids or boost the lows and highs more when dialing in at low volumes. When you then take that preset and crank it up loud, the bass and treble become even more prominent and it ends up boomy, harsh, and lacking in midrange.
Use the ISO 226:2003 Equal Loudness Contour graph as your reference:
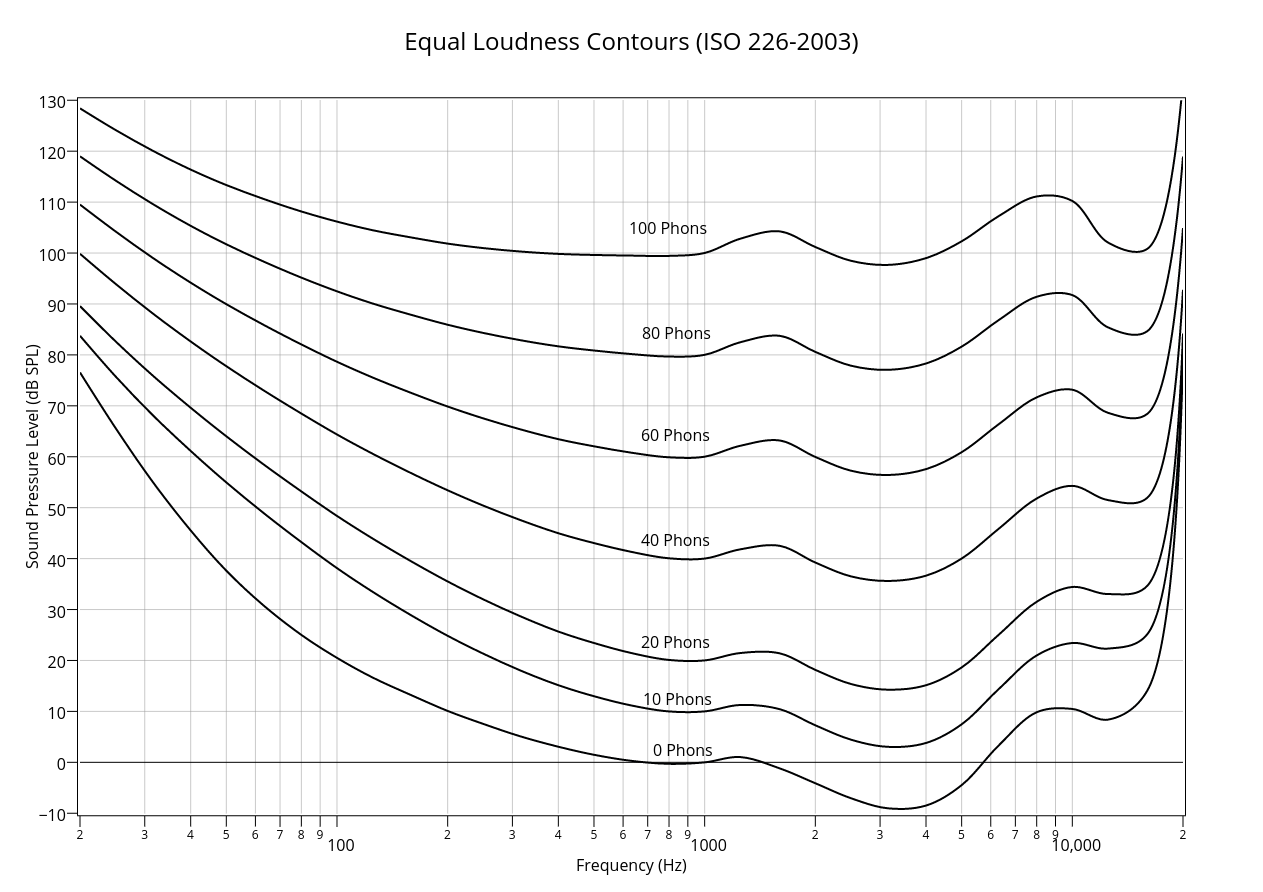
These curves can be a bit misleading though. They represent the difference in perceived volume based on frequency. A Phon is a unit of perceived loudness. It's basically like a dB but is offset to compensate for our hearing patterns. At 1 kHz, 1 Phon = 1 dB. Each curve shows how loud in dB each frequency has to be in order to be perceived at an equal loudness relative to the other frequencies. So for example, at an output level of 70 dBA, 1 kHz will have a perceived loudness of 70 Phon, but down at 100 Hz, it will only be perceived at about 45 Phon, a difference of roughly 25 dB or a bit over 4 times quieter. When comparing different listening levels, you have to compare the curves for the two different levels and look at the difference in shape between the two, not just their vertical position on the graph. You'll notice that there is little difference in the curve shapes in the midrange frequencies. The biggest differences are in the low and high frequency ranges as you move from low to high listening volumes.
Take the curve of the desired listening level and subtract the curve for the level at which you created the preset. That will give you the difference between the two curves at each frequency. If you then offset that curve by the total change in listening volume, you'll be left with the needed EQ compensation curve.
An easy way to visualize this is to superimpose the curves together to highlight their differences. Say we want to use a preset that was created at bedroom volume of about 60 dB for gigging at a loud level of 100 dB. With a little Photoshop magic we can move the 60 dB curve up 40 dB on the graph to compare their shapes.

You can see that the red 60 Phons curve is much higher in the low and high frequency range and is very similar in the midrange. What that tells you is in order to keep your preset sounding the same, you'll need to EQ to compensate that difference. Where the red original curve is above the new desired curve, you'll have to cut with EQ. Where it's below, you'll have to boost with EQ.
So based on these curves, taking a preset created at 60 dB and using it at 100 dB would require approximately the following global EQ to keep it sounding roughly the same.
31 Hz = -18 dB (-12 is max)
63 Hz = -15 dB (-12 is max)
125 Hz = -10 dB
250 Hz = -7 dB
500 Hz = -2 dB
1 kHz = 0 dB
2 kHz = +1 dB
4 kHz = +1 dB
8 kHz = 0 dB
16 kHz = -7 dB
The resulting EQ curve is a frown curve or a relative midrange boost. Of course this assumes that your sound system is totally linear throughout its whole output volume range. This is often not the case, so you still have to use your ears to fine tune the final EQ needed. The curves are also based on pure sine waves, so the effect with full program music is a bit different from person to person and with different material. Harmonically rich sounds like distorted guitars do all kind of weird things with our ears. It's often much more complicated than simple EQ curves, so your best bet is to always dial in your gig presets at gig volume.